从小编接到的咨询和项目来看,掐指一算,最近代谢组学那是相当火啊!
可火着火着,突然发现画风不对啦,怎么有的公司仍然继续推送一级谱图处理的代谢组数据呢?并且小编接到前方高能预警,竟然有同行说我们是用一级谱图处理数据的。小编在此严肃抗议、郑重声明,做人怎么能这样子呢!

今天小编做两件事,第一件事强调并解释一下代谢组学数据处理过程中尽量使用二级谱图的重要性;第二件事安利一个开源的代谢组学数据处理软件。
一、代谢组学中二级、二级、二级谱图数据库很重要
为什么二级如此重要?因为通过二级图谱数据库鉴定的结果可信度更高,一级图谱会造成很多假阳性结果,因为一级比对是按照荷质比(或者说分子量)进行比对的,谁也不能保证不同的代谢小分子其荷质比(或分子量)的唯一性!加入二级碎片的图谱会加深鉴定结果的可靠性。
看到这篇文章的人可能有很多人已接触过蛋白质组学,有的已经发表过相关文献,自然知道蛋白质组学研究中必用的是二级图谱数据库。所以,自然而然地会认为,代谢组学也是顺其自然地使用二级图谱数据库。(其实是小编自己的想法)
殊不知,其中乾坤很多啊……

在高通量蛋白质组学还没有现如今这么火爆、成熟的时期,一级谱图数据库在很长一段时间是占据主要地位的,而且我想有的老师仍在使用一级谱图数据库进行研究——即传统的蛋白质组学技术“肽指纹图谱”。小编在前几年期间,还能陆续接到如此的项目咨询。
后来由于质谱系统的迅速发展,加上物种蛋白数据库越来越完善,使用一级图谱进行鉴定的案例才会越来越少。
而代谢组学的数据库相对于蛋白质组学,获得会更加耗费人力物力。有一些开源的代谢组学数据库,里面的信息也是参差不齐,冗余很多。有的是一级、有的是二级,甚至有的物种是没有相对应的代谢组学数据库的。所以在比较长一段时间内,代谢组学的发展是受到数据库发展的限制的。
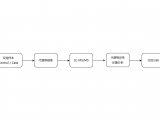
下面这张图展示了代谢小分子鉴定所需要数据库的一个发展历程:
 第一个:精确分子量(一级图谱),原因不佳见上述
第二个:精确分子量+同位素pattern
第三个:精确分子量+色谱保留时间+同位素pattern
第四个:二级图谱数据库
第五个:二级图谱数据库+色谱保留时间
现在小编的组织处于第四个阶段,这个二级图谱数据库是小编的同僚们购买了很多标准品在前期摸索建立起的二级图谱数据库,有助于提高代谢物鉴定的准确度。当然,通过这个数据库得到的鉴定结果,并不能说明鉴定得到的代谢物就是百分之百的准确。
要想得到更加准确的结果,就要练就第五级神功啦!阐述出来,就是再拿着一个个对应的代谢物标准品在相同条件下与样本同时期上机,通过二级图谱和色谱保留时间一起鉴定。
二、开源代谢组学数据处理软件——MetaboAnalyst
请牢记链接:www.metaboanalyst.ca/faces/home.xhtml。
虽然现在很多公司会使用SIMCA-P这个软件,这个软件用起来会更优化,但这个软件的商业版本是需要money地,并且每年是需要升级费和服务费的。教育版和破解版的,可能对于发文章有一定影响。
MetaboAnalyst里面能分析的内容很丰富,可以各取所需,下面是英文版本说明,请原谅我的懒惰:
Project objective: To provide a user-friendly, web-based analytical pipeline for high-throughput metabolomics studies. In particular, MetaboAnalyst aims to offer a variety of commonly used procedures for metabolomic data processing, normalization, multivariate statistical analysis, as well as data annotation. The current implementation focuses on exploratory statistical analysis, functional interpretation, and advanced statistics for translational metabolomics studies.
Data formats: Diverse data types from current metabolomic studies are supported (details) including compound concentrations, NMR/MS spectral bins, NMR/MS peak intensity table, NMR/MS peak lists, and LC/GC-MS spectra. —— 可以支持的数据格式
Data processing: Depending on the type of the uploaded data, different data processing options are available (details). This is followed by data normalization steps including normalization by constant sum, normalization by a reference sample/feature, sample specific normalization, auto/Pareto/range scaling, etc. —— 数据预处理
Statistical analysis: A wide array of commonly used statistical and machine learning methods are available: univariate - fold change analysis, t-tests,volcano plot, and one-way ANOVA, correlation analysis; multivariate - principal component analysis (PCA), partial least squares - discriminant analysis (PLS-DA) and orthogonal partial least squares - discriminant analysis (OPLS-DA); high-dimensional feature selection - significance analysis of microarrays (and metabolites) (SAM) and empirical Bayesian analysis of microarrays (and metabolites) (EBAM); clustering - dendrogram, heatmap, K-means, and self organizing map (SOM)); supervised classification - random forests and support vector machine (SVM).——统计学分析
Functional enrichment analysis: The service performs metatolite set enrichment analysis (MSEA) for human and mammalian species. It can accept a list of compound names, a list of compound names with concentrations, or a concentration table. The analysis is based on several libraries containing ~6300 groups of biologically meaningful metabolite sets collected primarily from human studies;——功能聚类分析
Metabolic pathway analysis: The service currently supports pathway analysis (including pathway enrichment analysis and pathway topology analysis) and visualization for 21 model organisms, including Human, Mouse, Rat, Cow, Chicken, Zebrafish, Arabidopsis thaliana, Rice, Drosophila, Malaria, Budding yeast, E.coli., etc., with a total of 1600 pathways;——代谢通路分析
Time series and Two-factor data analysis: The service currently supports clustering and visualization (including interactive 3D PCA visualization and two-way heatmaps with hierarchical clustering), two-way ANOVA for univariate two-factor analysis, multivariate empirical Bayes time-series analysis (MEBA) for detecting distinctive temporal profiles across different experimental conditions, andANOVA-simultaneous component analysis (ASCA) for identification of major patterns associated with each experimental factor (and their interactions); —— 统计学分析
Biomarker analysis: The service provides receiver operating characteristic (ROC) curve based approach for evaluating the performance of potential biomarkers. It offers classical univariate ROC analysis as well as more modern multivariate ROC curve analysis based on PLS-DA, SVM or Random Forests. In addition, users can manually pick biomarkers or to set up hold-out samples for flexible evaluation and validation;—— 生物标志物分析ROC
Sample size and power analysis: Users can upload a dataset either from a pilot study or from a similar study to compute the minimum number of samples required to detect the effect within a certain degree of confidence, as well as to estimate the power of the current study design.
Integrated pathway analysis: The service allows users to simultaneously analyze genes and metabolites of interest within the context of metabolic pathways. Only data from human, mouse and rat are supported currently.
Image generation: Important images can be re-produced in high resolution in various format such as .png, .tiff, .ps, etc for publication purposes
Report generation: Upon completion, a comprehensive PDF report will be generated documenting each step performed along with corresponding tabular and graphical results. The processed data and images are also available for download.
今天介绍就到此结束,下期可能会讲讲代谢组学中的样本设置问题!
原文链接:http://www.aptbiotech.com/page/76.htm
中科新生命 · 质谱系统解决方案专家
▼
生物医药结构确证
蛋白质组 - 修饰蛋白质组 - 代谢组 - 脂质组
▼
私聊 · 问题咨询
 公众号 ·行业动态
www.aptbiotech.com T: 021-54665263 E: info_apt@sibs.ac.cn Q: 1875681852


 首页
首页