For ionisation to take place at all, chemical reaction between the sample and the reagent gas must be exothermic. The grater the heat of the reaction, the more fragmentation will occur.
For a given sample the heat of the reaction depends only on the reagent gas used. The general equation is:
Heat of reaction = Proton affinity of reagent gas - Proton affinity of sample.
The heat of reaction must be negative for ionisation to take place. The statement shows that the reagent gases with high proton affinity will give lower heats of reaction. If ionisation occur, then these reagent gases will give strong molecular or quasi-molecular ions with little fragmentation (Fig. 16,17). Consideration of proton affinities allows the analyst to control fragmentation by selecting different reagent gases (table 2).
Table 2. Proton affinities of CI Reagent Gases.
Gas
Proton Affinity, Kcal/mol
Helium
42
Methane
127
Water vapour
167
Isobutane
195
Ammonia
207
Methane has a relatively low proton affinity and is likely to give some ionisation with an unknown sample than either isobutane or ammonia. It also has distinct advantage of being a reasonable carrier gas - sample-enrichment devise is not needed in the GC/MS interface and direct coupling is possible. This make methane the first choice for a general purpose CI reagent gas. Though there are several disadvantages that may be significant:
-there is usually significant CI reagent background spectrum, since the degree of fragmentation is greater than with some other reagent gases;
-methane gives a large number of addition ions, quasi-molecular ions, and fragments with the system oil background.
Ammonia does not give the same degree of background interference, but it higher proton affinity may prevent fragmentation. Ammonia also more difficult gas to handle - it is corrosive, hygroscopic and very reactive to all fittings, pipes, and valves.
Isobutane has also found widespread use as a general-purpose reagent gas, but it is less efficient than methane because of its greater molecular mass.
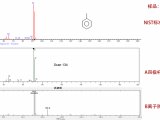
CI spectra of compounds produced with different reagent gases are given on Figure 16, 17.
Figure 16B. CI spectra of methyl stearate (MW 298) with (a) methane, (b) isobutane, and (c ) ammonia as reagent gases.
Figure 17. CI spectra of norleucine with (a) ammonia, and (b) methane.
Hence, there are several advantages of CI over the more conventional EI technique:
* more information on molecular ion, the molecular weight can be positively identified for many compounds;
* can be more sensitive and highly selective, compounds can be selectively ionised in a complex mixture by choosing a proper reagent gas;
* chemical isomers and stereoisomers can be distinguished;
* complements EI data (Fig. 18),
* there is less fragmentation, yielding simpler, more easily understood spectra, good for single ion monitoring;
* soft condition for labile compounds,
* mobile phase can also be used as reagent gas, allowing direct coupling to the MS.
Figure 18. Comparison of EI and CI spectra. (a) Norleucine at 70 eV EI, (b) Methane CI.
Negative Ion CI.
Traditionally, mass spectrometers have been configurated to investigate positive ions. For EI work this is reasonable, since most compounds yield a far greater number of positive ions than negative. With CI sources many ion source reaction yield negative ions, and in some cases ions of both polarity are formed. Observing both positive- and negative-ion spectra will give valuable information to the analyst. Negative ion CI is even more widely used than Positive ion CI since Negative Ion (NI) mass spectrums are usually very simple. Very often only molecular ion can be found in NI CI spectrum.
Since the positive and negative CI data are of significant interest together, it is often desirable to obtain both at the same time. To change from the positive to the negative mode requires that the polarity of the ion energy and lens plate voltage be reversed. With suitable power supply design, high-speed switching is possible on quadrupole instruments either during a scan, or on a scan-to-scan basis. The additional conversion dynodes, one for negative ions and one for positive ions, allows the multiplier to be used for both polarities.
5.3 Field ionisation (FI)
A schematic diagram of an FI ion source is shown in Fig. 19.
Figure 19. Schematic diagram of a field ionisation ion source.
The most important components are the electrodes, an a node and cathode, which are held at a potential difference of up to 10 kV and are sufficiently close together to develop a potential of up to 108 V cm-1 with a distance between electrodes 10-4 cm. When a sample molecule in the vapour phase impinges on the anode or comes very near to it, the potential gradient it experiences leads to an electron being transferred to the metal anode giving rise to the formation of a positive ion. It is attracted towards the cathode and as this has a hole in it, some ions pass through. Most mass spectrometers are designed to analyse ions travelling at velocities attained by acceleration through potential differences of 4000-8000 volts. The ions leaving the cathode of the FI source will have passed through a potential difference of about 10000 volts. The focusing devise beyond the cathode has two functions;
* it must retard the ions until they reach the correct velocity for analysis
* it must focus the diverging beam of ions coming through the cathode into a coherent beam for mass analysis
The cathode is often called the emitter, because molecules impinge upon it or come very close to it are emitted as ions. The emitter is usually a sharp blade, a sharp tip or a wire.
There is a little energy transfer to the molecule and thus very little fragmentation. The technique is usually yields abundant molecular ion.
Disadvantages of FI technique include:
* Uncertainty of the determination of relative molecular masses of unknown substances (Quasi-molecular ions are produced because of high sample concentration near anode);
* Emitter surface absorbs contaminants, which can be ionised and bonded to the sample molecule producing additional ions.
Advantages:
* FI usually shows some fragment ions that can be structurally informative (Fig. 20). Less fragmentation than in EI.
Figure 20. Mass spectrum of xanthsosine (a) using EI and (b) using FI.
5.4 Field Desorption (FD).
If vaporisation of the sample is a problem, it might be overcome by producing ions directly from the solid state. This is what FD does. It operates on the same principal as FI in that it uses an emitter held at a high temperature with respect to a cathode. But, the sample is placed on the surface of the emitter in the solid face state and ions are desorbed directly from the solid towards the cathode.
FD is a softest of the ionisation discussed in this lecture. Generally it only produces molecular ions with virtually no fragmentation.
5.5 Discharged Ion Secondary Ion MS (DISIMS) or Fast Atom bombardment (FAB).
In FAB technique a beam of fast moving neutral atoms are directed onto a metal plate coated with a sample, then much of the high kinetic energy of the atoms is transferred to the sample molecules on impact coursing ion ionisation. The bombarding atoms are usually gases, either xenon or argon. In order to achieve a high kinetic energy, atoms of the gas are first ionised and these ions are then passed through an electric field.
After acceleration, the fast moving ions pass into a chamber containing further gas atoms and collision of ions and atoms lead to charge exchange:
Xe+.(fast) + Xe(thermal) ? Xe(fast) + Xe+.(thermal)
The fast atoms formed retain most of the original kinetic energy of the fast ions and carry on in the original direction. Deflector plate with negative potential is employed to remove fast ions and the ions with thermal energies.
When the fast atoms bombard the sample, both positive and negative ions are formed. If the plate on which the sample is placed is held at suitable potential with respect to the an ion exit plate, either positive or negative ions can be directed towards the analyser. A schematic representation of the FAB source is shown in Fig. 21.
Figure 21. Schematic representation of a FAB source.
FAB spectra usually provide relatively abundant molecular or quasi-molecular ions and also show some structural important fragment ions.
Two examples involving both positive and negative ion FAB spectra are shown in Fig. 22a and 22b.
Figure 22. (a) Positive ion FAB Spectrum of Vasopressin (MW 1055); (b) Negative-Ion FAB Spectrum of Potassium Salt of Phenethicillin (MW 402).
6. Principles of MS analysers.
Once ionised, the sample molecules and their fragments can be separated on the basis of their different mass-to-charge ratios.
The most common forms of mass analyser used in GC/MS instruments are magnetic sector, quadrupole, and ion trap. Single focusing magnetic sector mass spectrometer will be discussed first. Fig.23.
6.1 Magnetic sector Mass-spectrometer.
Fig 23. Single focusing magnetic sector mass spectrometer.
Ions are accelerated from the ion source to the magnetic sector by the accelerating voltage V, that is usually very high (about 8000volts). The spread of the ion beam is limited by the source and collector slits. The gain in kinetic energy is proportional to the potential energy lost or potential difference (V) through which the ions have passed so that
1/2 mv2 = zV (1)
where z is the charge on the ion.
After acceleration ions enter the analyser region.
If current flows through a conductor in a magnetic field, then a force will be experienced at right angles to both the field and the direction of current. Electric current in our case can be defined as passage of positively charged particles. As it is not a conductor but particles themselves there are no physical restrain on the ions, so they will respond to the exerted force, which will always be at right angles to the direction of travel:
F = Bzv (2)
where B is a magnetic field strength, v - ion velosity.
Under this condition the resultant trajectory will be circular. If particle of mass m travels with velocity v around the circumference of a circle of radius r, then it experiences a centrifugal force
F = mv2/r (3)
so
mv2/r = Bzv (4)
From equation (1)
v2 = 2zV/m
From equation (4)
Bz = mv/r
v = Bzrt/m
v2 = B2z2r2/m2
so
2zV/m = B2z2r2/m2
m/z = B2r2/2V
To make ions that have different m/z ratios follow the correct trajectory and reach the detector one can either vary V keeping B constant or vary B keeping V constant. In first case it will be a voltage scanning spectrometer, in second a magnetic scanning spectrometer. Magnetic scanning instrument are more sensitive and are therefore used on all commercially available spectrometers.
The instrument can not distinguish between M+ and 2M2+ .
Resolution (or resolving power) is defined as the ability of the mass spectrometer to separate adjacent masses by a given amount. In the 10 % valley definition it is assumed that two masses 1 amu apart are separated with valley between them of a high equal to 10% of the peak height. (Fig.24)
Figure 24. Equivalence of 10 % valley resolution definition.
Resolving power is defined also as the mass to be measured divided by the difference in masses to be identified:
R=M/(M
Example1: Instrument has resolving power 4000.
Mass region of interest - 400.
Accuracy of measurement is 0.1.
Example 2:
a) The mass of C8H16+( is 112.12528 and that of C7H12O+( is 112.08888. The resolving power required is112 / 0.03640 = 3077
b) The mass of C40H82+( is 562.64206 and that of C39 H78O+( is 562.60566. The resolving power required is 562/0.03640 = 15440
Therefore only pair a) can be differentiated with magnetic analyser.
6.2 Double focusing mass-spectrometer.
The resolving power of magnetic mass spectrometer is limited by the factor that not all ions of the same m/z have exactly the same kinetic energy after acceleration. It is possible to reduce a spread of kinetic energies for each ion by applying an extra focusing devise between the ion source and the magnetic analyser. This takes a form of a pair of curved metal plates, called the electrostatic analyser (ESA) or electric sector with an electrical potential maintained across them.(Fig. 25)
Figure 25. Schematic diagram of mass spectrometer using both electrostatic and magnetic focusing.
Ions enter the plate with kinetic energy arising from accelerator:
1/2mv2 = zV
The ions are deflected towards the bottom plate. That is, ions experience a force acting at right angles to the direction of their flight. When the ions enter the region between the plates they experience the potential difference (E) between them. The force (F) acting on an ion of charge z, is given by eq.:
F=zE
Thus the electric force will tend to deflect the ions from their original flight path into a circular path. Provided that this electric force is balanced by the centrifugal force the ions attain as a consequence of their velocity, v, they follow a circular path which is the circumference of a circle of radius R:
zE = mv2/R
From previous equations:
mv2 = 2zV = zeR
R = 2V/E
Ions passing through the field E will follow curves of different radius depending on their kinetic energies.
Ions of any m/z values, which have been accelerated through a potential V and passed through a field E, all follow a curve of radius R, provided that they have the same kinetic energies. If their kinetic energies are different , trajectories of different radiuses will be observed (Fig. 26).
Figure 26. Flight paths of ions of different kinetic energies in a ESA.
A slit placed between the electrostatic analyser and the magnetic analyser only ions of the required kinetic energy, those that follow a circle of radius R, allows to pass through (Fig. 25).
An instruments that operate on this principles are known a s double-focusing mass spectrometer. In this devise an electric sector acts as an energy analyser, while the magnetic sector acts as a mass analyser. With such an instrument the resolving power 105 can be obtained.
Example3: To resolve a doublet arising from a difference of 13CH to N in the formulas of two ions requires a resolving power of about 6000 at mass 50 amu, 12,000 at mass 100 amu, and over 60,000 at 500 amu.
Only high resolution MS can do this job.
6.3 Quadrupole Mass Analyser.
Another common type of analyser used in mass-spectrometry is the quadrupole mass analyser, shown on Figure 27. Mechanically, the quadrupole is an extremely simple devise, but with a very complex mathematical theory behind, which will not be discussed here. As its name implies, a Quadrupole Mass Filter consists of four poles, or rods. In the cross section of quadrupole, the four rod are arranged at the corners of a square. In HP 5971/5972 MSD, these "rods" have been reduced to four metallic strips mounted on the interior surface of a glass tube. The quadrupole in the HP 5973 MSD is a fused-silica tube coated with a thin layer of gold. The tubes in each MSD have been formed so that the mounting areas have a hyperbolic cross-section. The dimension of tubes are accurate to within a few millionths of cm. The use of very accurate hyperbolically shaped rods theoretically gives the best mass peak shape and resolution for a quadrupole mass filter.
Figure 27. Fore rods in quadrupole mass analyser.
Two pairs of rods located between an ion source and a detector. Ions from an ion source enter the mass analyser region under very small accelerating potential, 5-15 V.
A voltage made up of two components is applied to the rods; the first component is a standard DC potential, and the second an radiofrequency component (RF):
Vx = + (Vdc + Vrfcos(t)
Vy = - (Vdc + Vrfcos(t)
Opposite rods are electrically connected. Considering only one pare of rods 2 and 3 on Figure 28 a, where rod 3 is at a positive potential with respect to rod 2 , positive ions will be drawn towards the negative rod. When RF voltage is applied at 1MHz the ions would be attracted to rod 2 when polarity is the same, and to rod 3 when polarity is reversed. This change in polarity is occurring at a very high rate and if we now sum together both components, the ions now follow an erratic path, which depend on their kinetic energy (Fig. 28 b).
a)
b)
c)
Figure 28. (A) Deflection of positive two ions between two rods set at a fixed potential difference; (B) at a variable (DC+RF) potential difference. c) Electrical connection between the rods of a qudrupole mass analyser.
The same DC voltage and RF field are also applied to rods 1 and 4. Simultaneously to their application to rods 2 and 3. The DC connections are such that rod 4 is at a negative potential with respect to 1, but the RF field applied to rods 1 and 4 is 180( out o phase with that applied to rods 2 and 3.
At any one pair of DC and RF values, only those ions of one particular kinetic energy pass directly between the rods and out the other end. All other ions collide with the rods.
If the ratio between the DC voltage and the RF field is kept the same, and both parameters are vary together, then ions of different m/z values can be analysed and a mass scan can be made.
As demonstrated in the Mathieu Stability Diagram (Fig. 29), more than one combination of DC and RF could be used to "control" a given mass. Therefore, the DC and RF must be set to produce a stable ion trajectory for only one amu at a time.. By using combination of DC and RF that occur above the scan line, only one amu will be stable on the mass filter and exit to be detected by the electron multiplier.
To define a line we need two points known as slope and intercept. ChemStation (in HP equipment) will refer to slope as amu Gain and intercept as amu Offset.. Amu gain affect ratio of DC voltage to RF frequency on the mass filter. This control the width of mass peaks. Increasing/decreasing the amu Gain will have an effect on low mass but a much greater effect of high mass. Amu offset also affects the ratio of DC voltage to RF frequency on the mass filter and also controls the width of the mass peaks. A higher offset yields narrower peaks. Increasing/decreasing the amu Offset will have an equal effect across the entire mass range.
Figure 29. Mathieu Stability Diagram.
The resolving power of quadrupole mass analyser is about the same as that of a single-focusing device, i.e. 5000.
The quadrupole mass filter has certain advantages over a magnetic sector instrument. This are as follows:
a) it is relatively cheap to build;
b) it is smaller and lighter;
c) more robust;
d) more accuracy is achieved in computer control of rod voltages rather then magnetic field;
e) the mass scale is linear, i.e. not proportional to B2;
f) scanning is very fast.
The scan rate is the time it takes record the spectrum. Scan is usually measured in number of seconds per decade of mass (mass changes by a factor of 10). Most scans are of the order of 1 sec per decade for magnetic-sector mass analyser. This is because magnets need a certain amount of time to reset before next scan. The
quadrupole mass analyser can scan its full mass range in a few ms, while its resetting time is even less.
Selective ion monitoring mode (SIM).
Due to quadrupole ability to perform scan and reset in a few ms and possibility to accurately control rod voltage, it is often used for selected ion monitoring. During a typical scan run, each mass is measured for approximately 100 usec. In contrast, each mass in SIM mode is typically 100 msec (Fig. 30). Since signal/noise is proportional to the square root of the measurement time, it follows that SIM mode will be roughly 30 times more sensitive than scan mode. In practice, improvements of 20-100 are possible.
Figure 30. Scan ans SIM modes in quadrupole mass analyser. (Note that the two figures on the opposite page are not to scale: the figure in scan mode should have about 4000 steps, which would make it unreadable).
6.4 Ion-trap analyser.
An ion trap is a devise that can store ions for an extended period of time by the use of electric and/or magnetic fields. Figure 31 shows a cross-section view of a simple ion trap. This consists of a central doughnut-shaped ring electrode and pair of end-cap electrodes.
Figure 31. Schematic diagram of an ion-trap mass analyser.
A variable RF voltage is applied to the ring electrode, while the two end caps are connected to earth. A burst of gaseous ions from the sample under investigation is introduced through a grid in the upper end cap. The RF voltage is then scanned. Ions with an appropriate m/z value circulate in a stable orbit within the ring cavity. As the voltage is increased, the orbits of the heavier ions become stabilised, while those of the lighter ions become destabilised, resulting in the latter leaving the cavity via openings in the lower end cap. The emitted ions then pass into a detector. As with the quadrupole mass analyser, the ion trap analyser is very simple and the resolution is of the order of 1 part in 1000.
Characteristics of ion-trap MS are as follows:
* compact design;
* lower cost;
* mass range limited by 500 amu
* does not require turning.
6.5. Time of flight analyser.
The principal of operation is based on the periodic production of positive ions by bombardment of the sample with brief pulses of electrons. The frequency of these pulses is typically 10-50 kHz, with lifetime of 0,25 usec. The positive ions that are formed are then accelerated by an electric field pulse of 103-104 V, which has a similar frequency but slightly lags behind the ionisation pulse. The accelerated ions pass into a region that contains no external field called drift tube ca. 1m in length. If all of the ions have the same kinetic energy, then liner velocity will depend on their masses-the heavier ions will arrive at the detector later than lighter. Mathematically this can be expressed by the following:
mv2/2 = zV
v2 = 2zV/m
v = ((2zV/m)
since
v = L/t
where L is a drift tube length, and t is a flight time
t = L((m/2zV)
The difference in transit time for two ions of masses m1 and m2 can be expressed as follows:
(t = L((m1 - (m2)/(2zV
Figure 32. Schematic diagram of a time-of-flight mass analyser.
Characteristics of TOF mass spectrometer:
* resolution is about 1 part in 1000.
* simplicity,
* virtually unlimited mass range,
* relatively high scan rate (900 amu on 1sec).
6.6 Ion cyclotron resonance MS (Fourier-Transform Instrument, FT-MS)
FT spectrometer contains an ion trap (section 6.4) within which ions are allowed to circulated in defined orbits over extended period of time. Ion-cyclotron resonance phenomenon describes the behaviour of these ions. When a gaseous ions moves into a strong magnetic field its motion become circular in a plane that is perpendicular to the direction of the field. The cyclotron frequency is defined as the angular frequency of this motion. Having an equation where centrifuge force is equal to magnetic field force we can write:
(c = v/r = Bz/m
Cyclotron frequency depends on only m/z value. When ion’s velocity is increased then ots radius of rotation will also increased.
An ions trapped in a circular path in a magnetic is also capable of adsorbing energy from an AC electric field if the frequency of the field matches the cyclotron frequency. When adsorbed, this energy can increase the ion’s velocity and, therefore its radius of travel without affecting (c. So only ions with similar cyclotron resonance frequency, i.e. similar m/z values will be set in motion in phase with the AC field, while ions with different m/z values will be unaffected. If such a group of ions approaches the upper plate, then induced electrons will be attracted from earth to this plate, thus causing a momentary current. The frequency of current is characteristic of the m/z value of the ions.
Characteristics of FT-ICR mass spectrometer:
* rapid scan
* wide mass range ( 5.000 amu
* very high resolution ( 106
* ions generation and mass analysis occur on the same region
* it is very easy to switch between positive- and negative- ion spectra
* very expensive.
7. Signal detectors.
The ion current flowing through the mass spectrometer in a GC/MS system is extremely small, but it may change rapidly over a wide range. To detect this current requires electronic circuits of high signal gain, wide dynamic range, and good frequency response. A current of 10-15 A, equivalent detection limit for normal GC/MS systems. Even above this limiting level the signals must be amplified significantly before the usual signal-processing and data-handling techniques can be applied. The amplification is usually achieved with an electron multiplier mounted within the mass spectrometer vacuum envelope. Multipliers provide a signal gain in the range 104 to 106. The current flowing out from them is still extremely small and is usually further amplified by high-input impedance amplifiers called electrometers.
7.1. Discrete dynode electron multiplier.
The detector consists of a series of electrodes (dynodes) arranged close to each other, with potential is about 200 V between plates (each stage is more positive than previous one). The dynodes have Cu/Be surfaces with good emissive properties. Ions strike the first plate, causing electron emission. The electrons skip down the plate, causing a cascade of further emission from each subsequent stage. Typically each stage contributes a factor of 2 or 3 to the gain, and so about 16 stages are needed (Fig.33).
Figure 33. Schematic diagram of the Discrete Dynode Electron Multiplier.
Characteristics:
* Gain about 106 can be achieved for multiplier in a good conditions
* The efficiency falls off as the surfaces become dirty due to contamination by water vapour, and the gain falls dramatically after a short exposure to the atmosphere.
* Procedure to rejuvenate the surfaces is straightforward.
7.2. Continues dynode electron multiplier.
A high negative voltage, 1800 V typically. Os applied across a glass trumpet, whose inner surface is coated with tin oxide. The coating serves both as the emitting surface and as the potential dropper. It is equivalent to a continuous thin-film metal oxide resistor, and a potential gradient is developed down the envelope. The incoming ion hits the inside surface of the electron multiplier’s horn, where it liberating electrons from the surface. These electrons cascade down the horn, ejecting more electrons with every impact (Fig. 34)
Figure 34. Continues dynode electron multiplier detector.
Characteristics:
* A gain of 105 to 106 is typically achieved with 1800 to 2000 V.
* finite supply of electrons. One may operate the electron multiplier at high sensitivity for a relatively short duration; alternatively, one may use the same electron multiplier at a lower voltage value fore a much longer time.
* extremely susceptible to surface contamination.
* not sensitive to water vapour, air, or the most common CI reagent gases
* can be removed for cleaning or exposed to the atmosphere during system shutdown without sudden loss of sensitivity.
7.3 Faraday cap.
Ions strike the collector electrode which is inclined with respect to the path of the ions so that particles striking or leaving the electrode are reflected away from the entrance to the cup. Collector electrode and surrounding cage are connected to ground potential. This act to neutralise the positive ions striking the plate by drawing electrons from ground through a resistor. The resulting potential drop across the resistor is amplified via an amplifier (fig. 35).
Figure 35. Schematic representation of the Faraday-sup detector.
Characteristics:
* no internal amplification, generates very low signal, poor for trace analysis., less sensitive than electron multiplier.
* simple and inexpensive.
7.4. Other Types of Detectors.
* Photographic plates coated with silver bromide emulsion. Can be used when simultaneous observation of a wide range of m/z values is necessary.
* Scintillation-type detector consists of a crystalline phosphor dispersed on a thin aluminium sheet which is mounted on the widow of a photomultiplier tube. The electrons produced when the positive ions strike a cathode, impinge upon the phosphor. Thus producing a scintillation which is detected by the photomultiplier tube.
8. Data recording.
Computers have become almost essential for full productivity from mass spectrometers, particularly GC/MS systems. A typical on-line mass spectrometer-computer system includes interface electronics, disk storage of data, and a visual display unit for presentation of mass spectra and chromatograms, in addition to facilities for making permanent copies of the graphs. The main features are illustrated in Fig. 36.
Figure 36. The possible communications of data system to other functions.
There are number of instrument variables that the computer controls:
* source temperature;
* accelerating voltage;
* scan rate;
* magnet field strength or quadrupole voltage ;
* integration of chromatographic peaks;
* background subtraction in GC/MS (for column bleed and instrumental contamination);
* control of the voltages to focus only in a limited, selected number of ions, instead of scanning complete mass spectra (quadrupole);
* store spectra and information on a disk;
* perform quick search of files from the library ((200 000 entries) that closely match the spectrum being investigated.
8.1 Computer control of mass spectrometer and data acquisition.
The electron multiplier sends out a continually varying electrical current or voltage called analogue signal . If it is to be handled by the computer it needs to broken up into segments, or digitised (Fig. 37)
Figure 37. Analogue and digital forms of a mass-spectrometer.
This is achieved by the use of an analogue-to digital converter (ADC) which samples the analogue voltage at very precise regular time intervals. A real digitised spectrum might include thousands of such voltage readings that will have some bearing on the processing time of the computer.
The amount of information being fed into the computer might be reduced by either reducing the number of sampling points (Fig. 38) or rejecting voltage reading below a certain threshold value by assuming that these points arise from the baseline noise in the signal (Fig. 39).
Figure 38. Peaks from a mass spectrum in analogue and digital forms, obtained by using different sampling rate.
Figure 39. Digital signal from a mass-spectrometer output, showing a threshold setting.
The singlet peak appears to be distorted and the doublets appears to be a very distorted singlet. Therefore too low sampling rate must be avoided. Rates of 10-20 point per amu ensure adequate mass measurement.
8.2. Scan Acquisition principles of HP quadrupole mass spectrometer.
There are two modes of acquisition available on the Chemstation: Scan and Selected Ion Monitoring (SIM).
Scan mode scans all the masses (within the range specified) generated during the acquisition process rather than only a selected number of masses. It is the mode to use when analysing
unknown compounds. It is also the mode to use if library searches to be applied.
Mass spectral data has three dimensions: retention time, mass, and abundance(Fig. 40). The mass axis goes into the page, the retention time axis goes across the page, and the abundance axis goes up the page.
Figure 40. Mass Spectral Data in Three Dimensions.
If we add the abundance’s at each instant in time and repeat for every scan, we will get the picture shown on Figure 41 a, b.
a)
b)
Figure 41. a) Spectrum vs. Retention time b) Total Ion Chromatogram -abundance versus time.
Figure 41 b is one way of looking at the data from the Chemstation. This is a plot of abundance versus time from a single injection. There is no information about what masses were detected. At each point in the chromatogram, the abundance’s of all the ions detected were added together to create the "total ion abundance" at that point in time. Thus, this is a "total ion chromatogram".
Mass peak detection.
At the beginning of a scan, the quadrupole mass filter is ready and waiting at the top of the specified scan range . To obtain a mass spectrum, the mass filter moves in regular, discrete step of 0.1 amu from the top of the scan range to the bottom. The number of times the abundance of each mass is measured or sampled during a scan is the sampling rate. The total time needed for one scan acquisition includes the time the quadrupole mass filter steps from high to low mass. The scan range and sampling rate affect this time. When the low end of the scan range is reached, the quadrupole mass filter is reset to the upper limit mass in preparation for the next scan. The reset time is less than the time required performing other operation, so the total cycle time is not affected by this reset time&


 首页
首页


