LC-MS data processing
N-glycan data were processed using UNIFI 1.7 with Glycobase 3+ (Waters Corporation, Milford, MA) for N-glycan structure. The peak area of chromatography was calculated for relative glycan quantification. The mean relative content and SD were determined for three replicates per sample. The MS2 data analysis was performed with MassLynx 4.1 data system. The data of intact hFSH subunits were deconvoluted and analyzed by UNIFI 1.7. The observed N-glycans structures were set as amino acid modification for deconvolution (mass error <50 ppm).
The LC-MSE data were processed using Biopharma Lynx 1.3.3 (Waters Corporation, Milford, MA) for N-glycosylation sites analysis. The mass tolerance was set at 5 ppm for precursor and 5 ppm for fragment ions, respectively. The identified peptides were confirmed by MSE spectra with at least five b/y fragment ions. The N-glycopeptide data were analyzed by ProteinLynx Global SERVER 3.0 (Waters Corporation, Milford, MA). In order to identify N-glycopeptides in rhFSH and uhFSH digest, N-linked glycosylation was selected as variable modification.
For O-glycopeptide identification, the data of HCD-pd-ETD were searched separately using Byonic 2.5.6 (Protein Metrics, San Carlos, CA) with the following search parameters: peptide tolerance = 10 ppm; fragment tolerance = 0.02 Da for both HCD and ETD; missed cleavages = 1; modifications: carbamidomethyl cysteine (fixed), methionine oxidation (common2). Mucin type O-glycan including Hex (mass of 162.0528), HexNAc (mass of 203.0794), HexNAc2 (mass of 406.1587), HexNAc2Hex1 (mass of 568.2116),NeuAc1HexNAc1Hex1 (mass of 656.2276) and NeuAc2HexNAc1Hex1 (mass of 947.3230) were set as database in the Byonic data searching. Spectrum-level FDR was set as auto cut. The PSM with score ≥100 and mass error <10 ppm were accepted.
In vivo bioassay for rhFSH and uhFSH biological activity
Protein contents were assessed by SEC-HPLC using BSA as standard. The in vivo bioactivity of hFSH was assessed according to current US and European Pharmacopoeias by the traditional Steelman-Pohley human chorionic gonadotrophin (hCG) augmentation assay, which measures ovarian hypertrophy following administration of exogenous FSH (in combination with hCG) to immature female rats.23
Results and Discussion
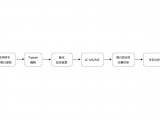
SEC-HPLC results showed that rhFSH, which was efficiently isolated using PuregonR,maintained its overall structural integrity and purity. For more accurate structural comparison between rhFSH and uhFSH, we employed a glycoproteomic strategy in characterizing glycosylation, including determination of intact masses, sialic acid contents, N-glycosylation sites, N-glycan structures, site-specific N- and O-glycans, and relative glycan quantities and specific activities (Figure 1a).
Molecular weight distribution of hFSHs
The intact rhFSH and uhFSH were analyzed using SDS-PAGE. The bands showed these intact proteins comprising glycosylated α- and β-subunits exhibited similar molecular weights of approximately 43 kDa (Figure 1b). The mass of each subunit was determined using high-resolution MALDI-TOF/TOF mass spectrometer (Figure 1b). The α- and β-subunits have the oretical molecular weights of 10 and 12 kDa, respectively. The mass range of the two subunits of rhFSH was 14–15 kDa, whereas that of the two subunits of uhFSH was 14–18 kDa. The mass of each subunit was further analyzed by UPLC-ESI-QTOF MS (Supporting Information Figure 1). The theoretical molecular masses of subunits and glycan chains were searched in the deconvoluted data. The results showed that the molecular masses of rhFSH subunits were in the range 13,710-17,264 Da, whereas those of uhFSH subunits were at 13,453-17,336 Da (Supporting Information Table 1). These results indicated that both proteins contain heterogeneous glycosylated isoforms. Moreover, the broader mass range of uhFSH suggested that glycosylation in uhFSH is more complex than in rhFSH.
Sialylation level and sialic acid contents
Isoelectric focusing (IEF) was used in isolating the hFSH charge analogues mainly according to their sialylation level, which increases the acidity of the isoform. The pI range of the isoform profile of rhFSH was 4–5, whereas that of uhFSH was 4–4.6 (Figure 1c). Therefore, the difference between the isoform profile of rhFSH and uhFSH indicated higher sialylation level in uhFSH.
Sialic acid content in each hFSH was further assessed. The sialic acid content of rhFSH was 11.5 ± 0.04 mol/mol protein, whereas that of uhFSH was 13.7 ± 0.04 mol/mol protein (Figure 1d). Sialylation level was higher in uhFSH than in rhFSH, and the uhFSH/rhFSH ratio was 1.19 ± 0.004 (p=0.0004). The sialic acid in hFSHs is highly important in their receptor binding ability, biological activity, and clearance from maternal circulation.24 Thus, the differences in the sialylation level of the hFSHs results in the differences in their biological properties.
Identification of N-Glycosylation sites
The N-glycosylation site generally contains an N-X-S/T sequence motif (where X ≠ Pro). The primary sequence of hFSH encodes two N-glycosylation sequons for each subunit;these N-glycosylation sites are located at N52 and N78 of the α-subunit and at N7 and N24 of the β-subunit. In high-resolution MS2 analysis, the conversion of N into D with an increase of 0.98 Da after removing N-glycans using PNGase F can be used in identifying N-glycosylation sites. All of four N-glycosylation sites were identified in hFSHs. Most of the sites were fully occupied by N-glycans, except βN24 in uhFSH, as the partial conversion was observed in mass spectra after deglycosylation (Figure 1e). Partial N-glycosylation of the FSH β-subunit was first reported in recombination bovine FSH.25 Both of the β-subunit carbohydrate residues were demonstrated to determine the metabolic clearance rate and in vivo potency of hFSH.26 The lack of oligosaccharides in the β-subunit possibly results in differences in delivery rates to target tissues and in elimination rates via filtration in the kidney.25
N-Glycan profiling and relative quantification
The N-linked glycans, released from each hFSH, were labeled with 2-AB at their reducing ends. The chromatography peak area was calculated for relative glycan quantification. The system was calibrated using an external standard of dextran ladder from which the retention time for individual glycan was converted into GU.27 The glycans were analyzed on the basis of their GUs, which were then compared with reference values in the “Glycobase” database for preliminary structural assignment. The preliminary structures of the glycans were further confirmed by their masses detected in MS.
Supporting Information Table 2 and Figure 2 show the profiling and relative contents of N-glycans through HILIC separation and fluorescence detection. The results showed that the two hFSHs possessed complexity in their carbohydrates, such as (a) degree of complexity in branching; (b) mainly complex type oligosaccharides; and (c) variations in core-/antenna-fucose and terminal sialic acid residues. However, the mono- and di-sialylated biantennary glycans were predominant in rhFSH at a relative amount of 46.23%, whereas the di- and tri-sialylated species, with bi- or tri-antennary glycans, were the most common forms in uhFSH. Moreover, the bisecting GlcNAc moieties linked to the core mannose residue were present in uhFSH. rhFSH also exhibited a more fucosylated distribution compared with uhFSH. The disialylated biantennary glycan NeuAc2HexNAc4Hex5 showed the highest relative content in both hFSHs despite the difference in sialic acid linkage of the two hFSHs. Approximately 10.20% of the oligosaccharides of rhFSH were not sialylated, whereas all of the glycan chains in uhFSH showed sialylation.
Some interesting N-glycans were further analyzed using tandem MS. LC-MS/MS analysis revealed the presence of NeuGc-containing, antenna-fucosylated, and sulfated glycans in rhFSH. The MS2 fragment ions obtained from the 2-AB labeled N-glycan at m/z 1180.43 described a complex type biantennary structure containing a NeuGc residue (Figure 3a). The protonated B1α and B3α ions at m/z 308.1 and 673.2, respectively, suggested the presence of NeuGc residue. Sulfated glycans at m/z 1214.44 were also
identified (Figure 3b). Moreover, the NeuAc residue was found to be sulfated at m/z 376.1. The dehydrated sodiated ions at m/z 538.1 and 741.2 further suggested the occurrence of sulfation.
The N-glycans of uhFSH were also investigated and data showed the presence of bisecting core-/antenna-fucosylated isomers. Figure 3c and 3d show the MS2 spectrum of Fuc2NeuAc1HexNAc5Hex5, [M+2H]2+. The two isomers were successfully revealed based on the differences in retention times shown by HILIC. The diagnostic ions indicated that the first isomer contains bisecting biantennary structure with antenna fucosylation, whereas the second isomer is indicative of a triantennary oligosaccharide with core and
antenna fucosylation.
rhFSH contains the NeuGc residue, which is an unusual and immunogenic oligosaccharide.28 Moreover, core and antenna fucosylations were both found in the two hFSHs. Fucose addition is as important as addition of sulfate group or sialic acid because it ensures proper binding to appropriate receptors.29 Furthermore, terminal sialic acids and sulfate groups regulate the biological half-life of hFSH.30 Bisecting GlcNAc also increase liver and spleen uptake of glycoproteins that possess the structural feature described above.31 The glycan isomers of uhFSH have been detected in various peaks in chromatograms, indicating the complexity of N-glycosylation.


 首页
首页


