With Eulers relationship,
![]() (6)
(6)
it is possible to express the impedance as a complex function. The potential is described as,
![]()
(7)
and the current response as,
![]() (8)
(8)
The impedance is then represented as a complex number,
 (9)
(9)
Data Presentation
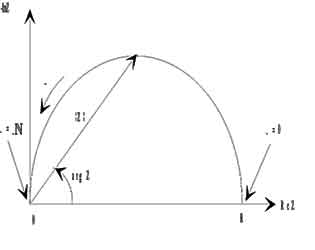
Look at Equation 9 in the previous section. The expression for Z(ω) is composed of a real and an imaginary part. If the real part is plotted on the X-axis and the imaginary part is plotted on the Y-axis of a chart, we get a "Nyquist Plot" (see Figure 3). Notice that in this plot the Y-axis is negative and that each point on the Nyquist Plot is the impedance at one frequency. Figure 3 has been annotated to show that low frequency data are on the right side of the plot and higher frequencies are on the left.
On the Nyquist Plot the impedance can be represented as a vector (arrow) of length |Z|. The angle between this vector and the X-axis, commonly called the “phase angle”, is f (=arg Z).

Figure 3. Nyquist Plot with Impedance Vector
Nyquist Plots have one major shortcoming. When you look at any data point on the plot, you cannot tell what frequency was used to record that point.
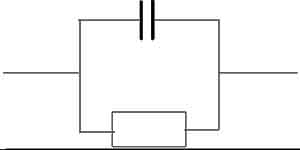
The Nyquist Plot in Figure 3 results from the electrical circuit of Figure 4. The semicircle is characteristic of a single "time constant". Electrochemical impedance plots often contain several semicircles. Often only a portion of a semicircle is seen.

Figure 4. Simple Equivalent Circuit with One Time Constant
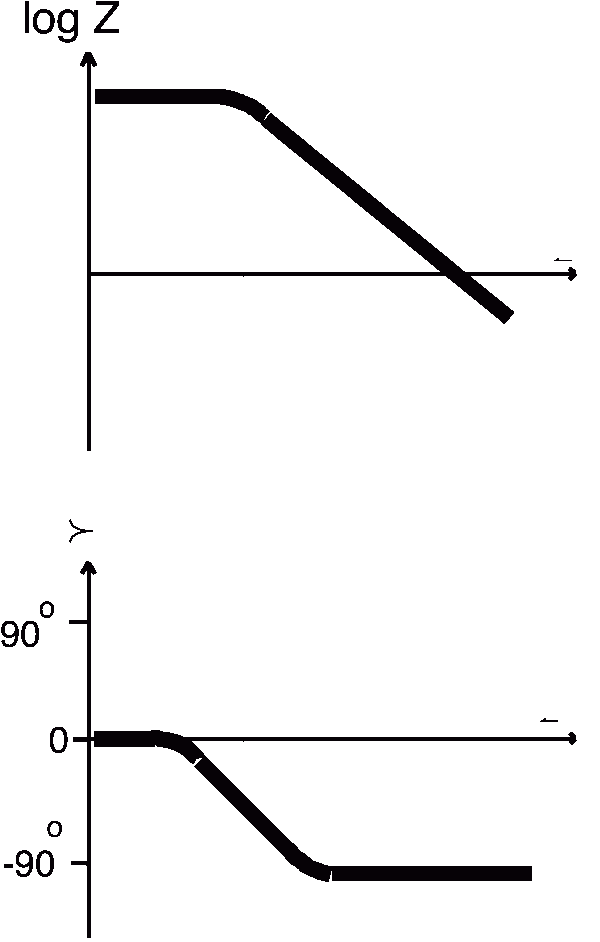
Another popular presentation method is the Bode Plot. The impedance is plotted with log frequency on the X-axis and both the absolute values of the impedance (|Z|=Z0) and the phase-shift on the Y-axis.
The Bode Plot for the electric circuit of Figure 4 is shown in Figure 5. Unlike the Nyquist Plot, the Bode Plot does show frequency information.

Figure 5. Bode Plot with One Time Constant
Linearity of Electrochemistry Systems
Electrical circuit theory distinguishes between linear and non-linear systems (circuits). Impedance analysis of linear circuits is much easier than analysis of non-linear ones.
The following definition of a linear system is taken from Signals and Systems by Oppenheim and Willsky:
A linear system ... is one that possesses the important property of superposition: If the input consists of the weighted sum of several signals, then the output is simply the superposition, that is, the weighted sum, of the responses of the system to each of the signals. Mathematically, let y1(t) be the response of a continuous time system to x1(t) ant let y2(t) be the output corresponding to the input x2(t). Then the system is linear if:
1) The response to x1(t) + x2(t) is y1(t) + y2(t)
2) The response to ax1(t) is ay1(t) ...
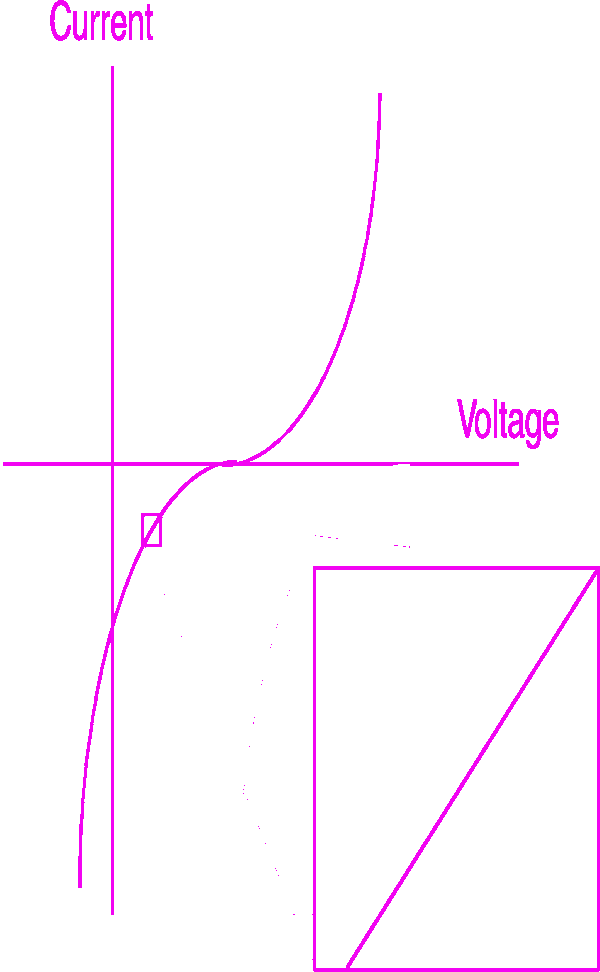
For a potentiostated electrochemical cell, the input is the potential and the output is the current. Electrochemical cells are not linear! Doubling the voltage will not necessarily double the current.
However, Figure 6 shows how electrochemical systems can be pseudo-linear. If you look at a small enough portion of a cell's current versus voltage curve, it appears to be linear.

Figure 6. Current versus Voltage Curve Showing Pseudo-Linearity