In normal EIS practice, a small (1 to 10 mV) AC signal is applied to the cell. With such a small potential signal, the system is pseudo-linear. We don't see the cell's large nonlinear response to the DC potential because we only measure the cell current at the excitation frequency.
If the system is non-linear, the current response will contain harmonics of the excitation frequency. A harmonic is a frequency equal to an integer multipled by the fundamental frequency. For example, the “second harmonic” is a frequency equal to two times the fundamental frequency.
Some researchers have made use of this phenomenon. Linear systems should not generate harmonics, so the presence or absence of significant harmonic response allows one to determine the systems linearity. Other researchers have intentionally used larger amplitude excitation potentials. They use the harmonic response to estimate the curvature in the cell's current voltage curve.
Steady State Systems
Measuring an EIS spectrum takes time (often up to many hours). The system being measured must be at a steady state throughout the time required to measure the EIS spectrum. A common cause of problems in EIS measurements and analysis is drift in the system being measured.
In practice a steady state can be difficult to achieve. The cell can change through adsorption of solution impurities, growth of an oxide layer, build up of reaction products in solution, coating degradation, or temperature changes, to list just a few factors.
Standard EIS analysis tools may give you wildly inaccurate results on a system that is not at steady state.
Time and Frequency Domains and Transforms
Signal processing theory refers to data representation domains. The same data can be represented in different domains. In EIS, we use two of these domains, the time domain and the frequency domain.
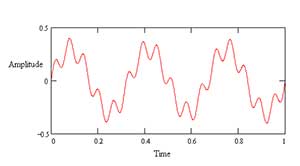
In the time domain, signals are represented as signal amplitude versus time. Figure 7 demonstrates this for a signal consisting of two superimposed sine waves.

Figure 7. Two Sine Waves in the Time Domain
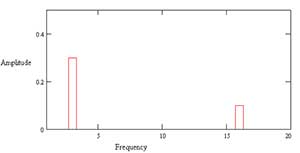
Figure 8 shows the same data in the frequency domain. The data is plotted as amplitude versus frequency.

Figure 8. Two Sine Waves in the Frequency Domain
You use a transform to switch between the domains. The Fourier Transform takes time domain data and generates the equivalent frequency domain data. The common term, FFT, refers to a fast, computerized implementation of the Fourier transform. The inverse Fourier transform changes frequency domain data into time domain data.
In modern EIS systems, lower frequency data are usually measured in the time domain. The controlling computer applies a digital approximation to a sine wave to the cell by means of a digital-to-analog converter. The current response is measured using an analog-to-digital converter. The FFT is used to convert the current signal into the frequency domain.
Details of these transforms are beyond the scope of this Application Note.
EIS data are commonly analyzed by fitting to an equivalent electrical circuit model. Most of the circuit elements in the model are common electrical elements such as resistors, capacitors, and inductors. To be useful, the elements in the model should have a basis in the physical electrochemistry of the system. As an example, most models contain a resistor that models the cell's solution resistance.
Some knowledge of the impedance of the standard circuit components is therefore quite useful. Table 1 lists the common circuit elements, the equation for their current versus voltage relationship, and their impedance.
Table 1. Common Electrical Elements
Component | Current Vs.Voltage | Impedance |
resistor | E= IR | Z = R |
inductor | E = L di/dt | Z = jωL |
capacitor | I = C dE/dt | Z = 1/jωC |
Notice that the impedance of a resistor is independent of frequency and has no imaginary component. With only a real impedance component, the current through a resistor stays in phase with the voltage across the resistor.
The impedance of an inductor increases as frequency increases. Inductors have only an imaginary impedance component. As a result, the current through an inductor is phase-shifted -90 degrees with respect to the voltage.
The impedance versus frequency behavior of a capacitor is opposite to that of an inductor. A capacitor's impedance decreases as the frequency is raised. Capacitors also have only an imaginary impedance component. The current through an capacitor is phase shifted 90 degrees with respect to the voltage.
Serial and Parallel Combinations of Circuit Elements
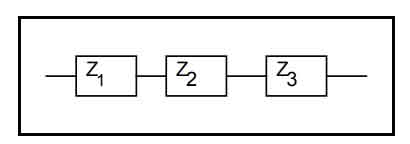
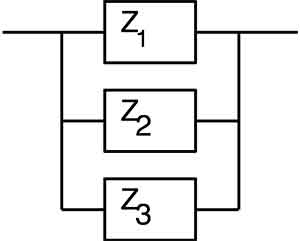
Very few electrochemical cells can be modeled using a single equivalent circuit element. Instead, EIS models usually consist of a number of elements in a network. Both serial (Figure 9) and parallel (Figure 10) combinations of elements occur.
Fortunately, there are simple formulas that describe the impedance of circuit elements in both parallel and series combination.

Figure 9. Impedances in Series
For linear impedance elements in series you calculate the equivalent impedance from:
![]()
(10)

Figure 10. Impedances in Parallel
For linear impedance elements in parallel you calculate the equivalent impedance from: