Mixed Kinetic and Diffusion Control
Consider a cell where semi-infinite diffusion is the rate determining step, with a series solution resistance as the only other cell impedance.
A Nyquist Plot for this cell is shown in Figure 17. Rs was assumed to be 20 Ω. The Warburg coefficient, σ, is calculated to be about 150 for the diffusion of a species with a bulk concentration of 100 μM and a typical diffusion coefficient of 1.6 x10⁻⁵ cm2/s. Notice that the Warburg impedance appears as a straight line with a slope of 45°.
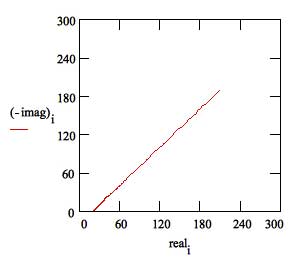
Figure 17. Nyquist Plot for a Warburg Impedance
The same data is plotted in the Bode format in Figure 18. The phase angle of a Warburg impedance is 45˚.
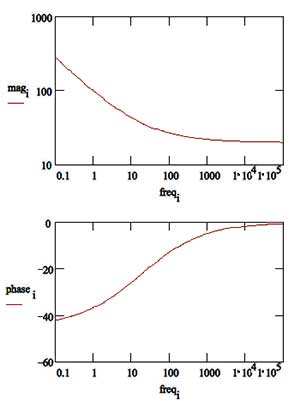
Figure 18. Bode Plot for a Warburg Impedance
Adding a double layer capacitance and a charge transfer impedance, we get the equivalent circuit in Figure 19. Since there is no simple element to model a Warburg impedance, it isn’t possible to construct a dummy cell that models the Randles Cell.
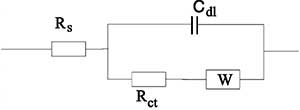
Figure 19. Randles Cell: Equivalent Circuit with Mixed Kinetic and Charge-Transfer Control
This circuit models a cell where polarization is due to a combination of kinetic and diffusion processes. The Nyquist Plot for this circuit is shown in Figure 20. As in the above example, the Warburg coefficient , σ, is assumed to be about 150. Other assumptions: Rs = 20 Ω Rct = 250 Ω and Cdl = 40 μF.
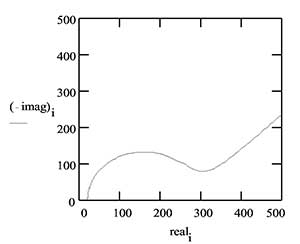
Figure 20. Nyquist Diagram for Mixed Control Circuit
The Bode Plot for the same data is shown in Figure 21. The lower frequency limit was moved down to 1 mHz to better illustrate the differences in the slope of the magnitude and in the phase between the capacitor and the Warburg impedance.
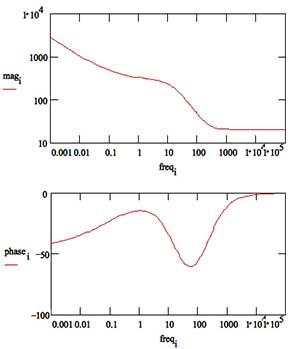
Figure 21. Bode Plot for the Mixed Control Circuit
