
上期我们了解了合并表格的原理和操作方法,本期让我们一起学习高级聚类热图。是什么,怎样看,怎么用,怎么用迈维云平台绘制(迈维云友情链接:https://cloud.metware.cn),且看教学视频和详细介绍!
视频解说教程
1
什么是热图
在文章中,我们经常会看到红绿(红蓝)相间色彩丰富的小格子组合成的一张图片,并且会对行数据和列数据进行聚类,这个图我们称为聚类热图(也叫Heatmap)。热图的基本原则是将数据矩阵的数值,按照一定的规律转换为颜色,通过颜色的不同变化来展示数据的差异。
2
热图的应用范畴
热图常常用来表示不同样品间基因表达,蛋白质表达,代谢物表达的含量差异或者不同组学间两两相关性。

图1. 差异基因(蛋白,代谢物)聚类热图

图2. 蛋白与代谢物相关性聚类热图
3
热图要怎么看
以不同样本基因表达量为例,在热图中,每一行代表一条基因,每一列代表一个样本。热图中每个单元格的颜色展示的对应列样本的行基因的表达量情况。颜色根据表达量的高低由红变绿,颜色越红表达量越高;颜色越绿表达量越低。

图3. 基因表达聚类热图
在热图中,可以对列数据进行聚类,聚到一起的数据代表这些样本所有基因的表达趋势是比较一致的,这些样本的相关性是比较好的,如果是一组样本的不同生物学重复,说明这组样本生物学重复比较一致。也可以对行数据进行聚类,聚到一类的基因代表,这些基因在所有样本中变化趋势比较一致,延伸到生物学中,可能是一类共表达基因或者同源基因,或者同一家族基因。
4
热图的作用
在实际应用中,聚类热图通常有两个功能。
1)进行数据质量控制
通过观察下图,我们可以看到,该热图对列数据,进行了聚类。通过观察上部的树形图及颜色图例的区分可以看到。橙色样本的B组样本,与玫红色样本的D组样本并不是各自的生物学重复聚集到了一起,而是不同组样本分散聚类。尤其是D组样本,有两个样本与B组样本聚到了一起,有一个样本与A组样本聚到了一起。这里可以反映两个问题,其一,D组样本与B组样本A组样本差异比较小,所以进行聚类是并没有明显区分;其二,D组样本生物学重复不好,导致D组样本本身差异比较大。这种情况可以结合PCA数据和样本相关性图一起分析,可以反映D组样本的真实情况。
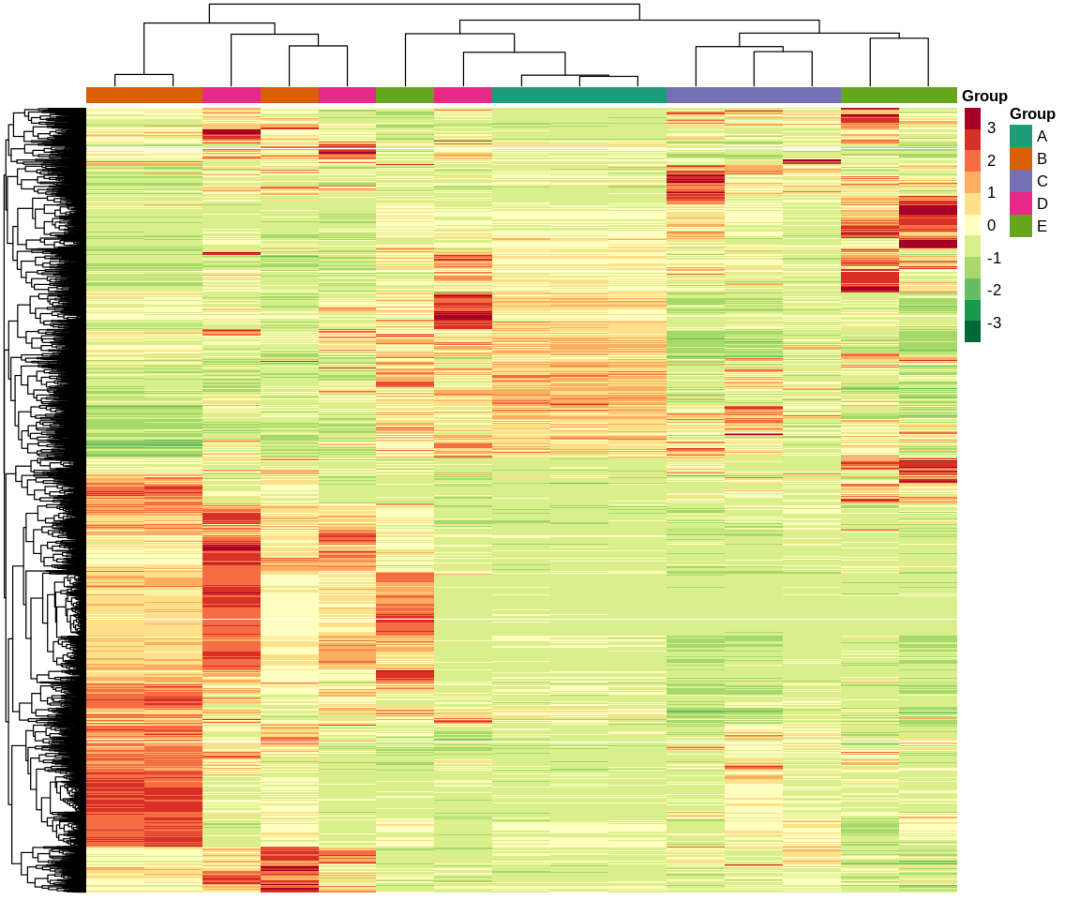
图4. 所有样本基因聚类热图
2)直观展示重点研究对象的差异变化情况
热图的另一个作用是直观展示重点研究对象的表达量数据差异变化情况。一次实验中检测到的基因或蛋白或者代谢物往往成千上万,将所有样本的所有数据进行展示,往往无法看清不同样本的真正差异情况。那么我们可以把两组间的差异基因用聚类热图展示出来。如下图所示,通过展示差异基因的聚类热图,我们可以清晰的看到A组样本,上部分基因表达量比C组样本高。下部分基因表达量比C组基因低。
图5. 差异基因表达聚类热图
5
热图在文章中怎么描述
1)非聚类的所有样本代谢物的展示热图描述
A total of 540 distinct annotated metabolites were identified in at least one tissue, including 70 flavonoids, 76 amino acid and derivatives, 54 lipids, 52 organic acids, 50 nucleotide and derivatives, 14 phenolamides, 32 alkaloids, 43 hydroxycinnamoyl and derivatives, nine polyphenols, 13 carbohydrates, 12 vitamins, 10 benzoic acid and derivatives, 18 polyamines, and 87 additional compounds that did not fit into these 13 main classes . Analysis of the 540 metabolites among different tissues showed that they could be divided into three large groups: metabolites present in vegetative tissues (roots, stems, and leaves), flower tissues (buds and flowers), and fruit tissues (pericarp throughout fruit development). This result indicates that vegetative tissues at different developmental stages have similar metabolic patterns, which are significantly different from those of fruit tissues. For example, metabolites such as lipids, alkaloids, hydroxycinnamoyl and derivatives, and phenolamides accumulate preferentially during vegetative tissues, whereas fruit tissues have substantially higher levels of amino acid and their derivatives, flavonoids, nucleotide and their derivatives, organic acids, polyphenols, and vitamins (Figure 2A)。(Yan Li et al. Molecular Plant,2020)

图6. 所有代谢物在不同发育时期的表达热图
2)样本和代谢物分别聚类的热图
Hierarchical cluster analysis (HCA) based on the relative contents of flavonoids showed that most metabolites detected in the developing grain changed significantly (Figure 3A). Based on their accumulation patterns during grain development, flavonoids could be grouped into three subclusters.The flavonoids in cluster I prominently accumulated at the 10 and 15 DAF time points and were mainly represented by procyanidins, tricin 5-O-hexoside, tricin 5-O-hexosyl-O-hexoside, tricin 7-O-hexoside, and tricin 7-O-hexosyl-O-hexoside. In contrast, flavonoids in cluster III were primarily composed of quercetin 7-O-malonylhexosyl-hexoside, quercetin 3-O-glucoside, and quercetin 5-O-malonylhexosyl-hexoside, and these were commonly distributed at 25 and 30 DAF. Interestingly, flavonoids in cluster II were mainly represented by xanthohumol, limocitrin O-hexoside, and glycitin, with the highest levels detected at 20 DAF. Consistent with the PCA results, the metabolite content was similar between 10 and 15 DAF but different from that at 25 and 30 DAF. Remarkably, at the 20 DAF time point, the metabolite content was clearly distinguished from other points. (Fang Wang,et al,Journal of Agricultural and Food Chemistry,2021)。
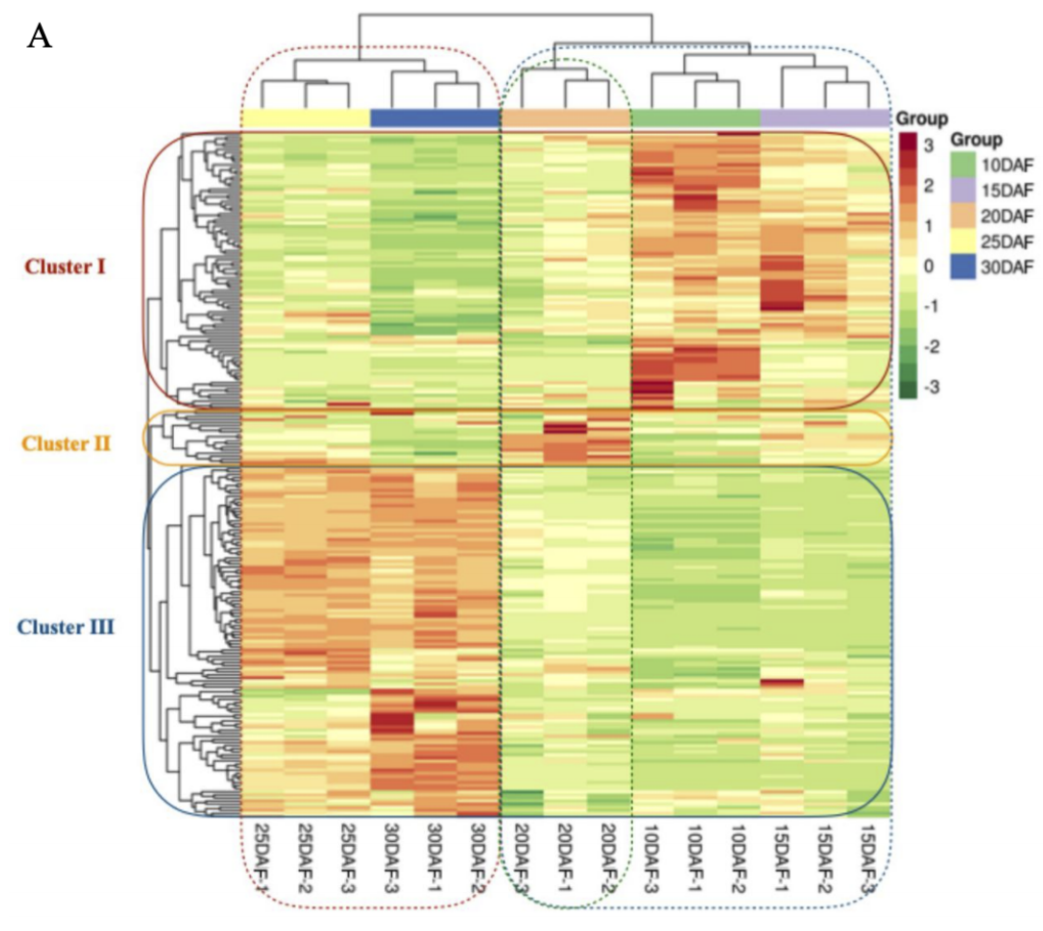
图7. 所有代谢物在不同样本的聚类热图
3)差异基因筛选后展示聚类热图
To explore DEGs in the peels of HJH compared to SHHJ, volcano plots of DEGs and the gene expression profile clustering between biological replicates were subjected to analyze (Figure S3c). A total of 3,517 DEGs were identified in HJH compared to that in SHHJ with the threshold of | log2(fold change) | 1 and FDR < 0.05, of which 1,453 and 2,064 genes were up-regulated and down-regulated, respectively. In addition, the hierarchical clustering analysis for DEGs showed that the expression patterns of two varieties were different。(Fangqin Yu et al,Scientia Horticulturae,2022)

图8. 差异基因聚类热图
6
聚类热图绘制过程中的数据标准化
对于一组待聚类的样本而言,它会有很多的特征用于聚类。比如对于一组转录组数据的样本,不同的基因代表不同的特征。转录组中通常使用FPKM来代表基因的表达量,如果绘制基因聚类热图时,不进行数据标准化。某一些特殊表达量特别高的基因影响,会导致其他基因的差异在热图上展示并不显著。所以,绘制热图时通常会对基因的PFPKM数据进行标准化。最常用的方法是使用z-score的标准化处理方法。z-score,它的含义是减去均值,除以标准差。使得所有基因的Z值都位于一定范围内。

电话:027-62433042
邮箱:support@metware.cn
网址:www.metware.cn


 首页
首页
